

As someone who designs digital modules, virtual labs, and interactive engineering coursework every day, I often see educators feel intimidated when the phrase “predictive analytics” enters the faculty lounge. It often sounds like an overengineered corporate catchphrase or an invasive surveillance algorithm meant to replace teacher intuition. But when you look at it through the lens of instructional design and computer science, predictive analytics is simply a smart, supportive compass. In technical education, foundational subjects like calculus, statics, or computer programming build sequentially; if a student trips over a fundamental concept in week three, they are almost guaranteed to fall completely behind by week seven.
Traditionally, we only noticed a learner was drowning after their midterm exam returned covered in red ink, which is often far too late to salvage their semester or build back their confidence. Predictive analytics changes that paradigm by evaluating ongoing interaction markers—like submission latency, activity completion frequency, and formative quiz attempts—to identify subtle friction points before they become academic failures.
When implemented properly, these systems do not strip away the human touch of teaching; instead, they highlight exactly where a warm check-in or a targeted tutorial is needed most. Approaching data this way turns an intimidating dashboard into a practical roadmap for student success.
Predictive analytics in education utilizes extensive datasets and analytical tools to enhance decision-making within schools and universities. By identifying trends and patterns, it allows educators to foresee potential challenges and tailor interventions for at-risk students. This systematic approach can improve academic outcomes while optimizing resource allocation and strategic planning. The integration of predictive models fosters a responsive learning environment that can adapt to student needs. Further exploration reveals additional insights into its transformative potential and practical applications.
KEY TAKEAWAYS
- Predictive analytics leverages data to identify student performance trends, enabling proactive interventions in educational settings.
- By analyzing historical data, schools can forecast enrollment trends and allocate resources more effectively.
- Early warning systems powered by predictive analytics help identify at-risk students, facilitating timely support and tailored learning paths.
- Integrating predictive analytics fosters collaboration among educators and data specialists, enhancing decision-making processes within institutions.
- The use of AI-driven algorithms in predictive models offers personalized learning experiences, improving overall student engagement and success.
WHAT IS PREDICTIVE ANALYTICS IN EDUCATION?
Predictive analytics in education means using previous data and algorithms to understand future student outcomes and identify potential issues.
Predictive analytics in education represents a transformative approach to understanding and enhancing student outcomes. This methodology employs sophisticated analytical tools to gather and interpret vast datasets related to student performance, attendance, and engagement.
By leveraging data interpretation, educators can identify patterns and trends that may influence academic success or challenges. In essence, predictive analytics functions as a proactive mechanism, allowing institutions to forecast potential issues before they arise.
This enables targeted interventions tailored to individual student needs, promoting a more personalized learning experience. Additionally, the integration of predictive analytics into educational frameworks fosters a culture of data-driven decision-making, enhancing resource allocation and instructional strategies.
Ultimately, this innovative approach equips educators with the insights necessary to create supportive environments that cater to diverse student populations, thereby optimizing educational outcomes and fostering a commitment to continuous improvement within the academic landscape.
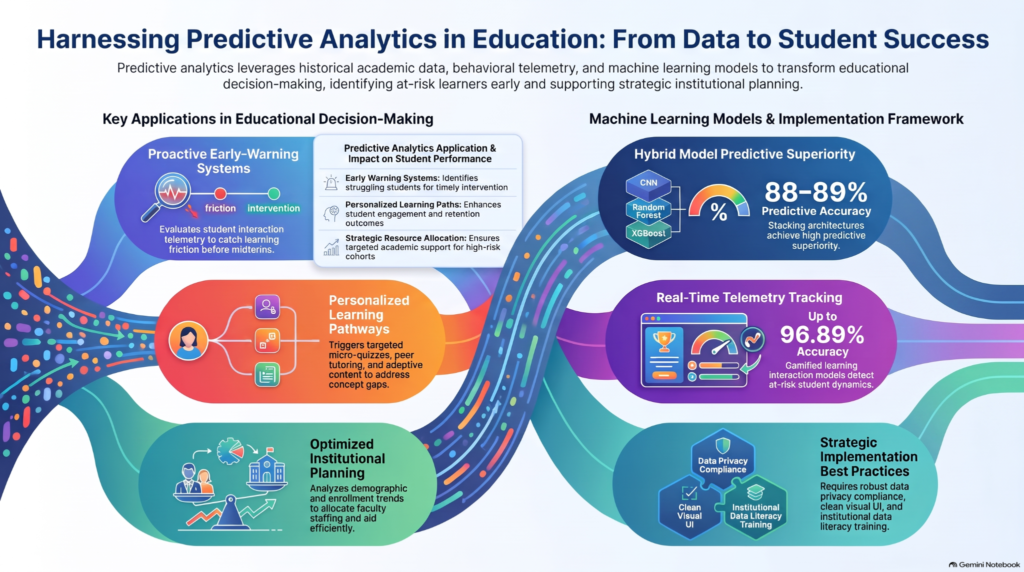
How Can Predictive Analytics Improve Student Outcomes?
While traditional educational methods often rely on intuition and past experiences, the integration of predictive analytics offers a more systematic approach to enhancing student outcomes. By analyzing data on student performance, learning habits, and demographic factors, educational institutions can identify at-risk students and tailor intervention strategies accordingly. Integrating technology in the classroom allows educators to use digital tools, monitor student progress, and deliver personalized learning activities that address individual academic needs. This data-driven insight fosters personalized learning experiences, ensuring that each student receives the support they need to thrive academically.
Predictive analytics enables educators to foresee potential challenges, allowing for timely interventions that can mitigate issues before they escalate. For instance, early identification of students struggling with specific subjects can lead to targeted tutoring or modified instructional approaches.
Additionally, by continually evaluating the effectiveness of these strategies, schools can refine their methods, ensuring that resources are allocated efficiently. Ultimately, predictive analytics empowers educators to create a more responsive and supportive learning environment, greatly improving student outcomes.
Top Uses of Predictive Analytics in Education Settings
Predictive analytics is powered by artificial intelligence (AI) and aims to predict future results by evaluating the past. It’s an exciting new technology already adopted in dozens of industries, and we believe it has tremendous potential to improve education.
Predictive analytics in education offers significant insights into key areas such as student performance prediction and enrollment trend analysis.
By leveraging historical data, educational institutions can identify patterns that forecast student outcomes, enabling timely interventions.
Additionally, understanding enrollment trends equips administrators with the knowledge to optimize resource allocation and strategic planning.
Student Performance Prediction
As educational institutions increasingly seek to enhance learning outcomes, the application of analytics to forecast student performance has gained significant traction. By leveraging learning analytics, educators can identify at-risk students and tailor interventions to improve engagement and retention. Predictive models utilize various data points—such as attendance, grades, and participation—to discern patterns that influence academic success. Monitoring student progress through these data points can help schools assess adaptive learning systems effectiveness, determine whether personalized instruction improves academic performance, and refine teaching strategies based on measurable results.
| Predictive Analytics Applications | Impact on Student Performance |
| Early Warning Systems | Identifies students needing support |
| Personalized Learning Paths | Enhances student engagement and outcomes |
| Resource Allocation | Guarantees targeted support for struggling students |
Ultimately, these insights empower educators to make informed decisions, fostering an environment conducive to academic achievement.
Enrollment Trend Analysis
The utilization of analytics extends beyond individual student performance, encompassing broader enrollment trends that greatly influence institutional strategy. By analyzing enrollment patterns and demographic shifts, educational institutions can proactively adapt to changing needs and optimize resource allocation.
This data-driven approach enables schools and universities to make informed decisions regarding recruitment, retention, and program offerings.
Key insights from enrollment trend analysis include:
- Identification of emerging demographic groups and their unique educational needs
- Anticipation of enrollment fluctuations based on historical data and external factors
- Enhancement of marketing strategies tailored to specific populations
- Development of targeted support services to improve student retention rates
Through these insights, institutions can foster environments that promote academic success and community engagement.

WHAT CHALLENGES DO SCHOOLS FACE WITH PREDICTIVE ANALYTICS?
When we examine the architectural side of predictive models, the key distinction often comes down to predictive versus prescriptive application. A system that simply flags that a student has a 75% probability of failing a thermodynamics course is only half useful—and frankly, it can create anxiety for faculty rather than clarity. The real breakthrough happens when models pair early pattern detection with actionable, automated instructional scaffolding. In gamified learning environments or adaptive engineering modules, learner telemetry moves fast. If a student is taking four attempts to finish an introductory logic gate simulation or their leaderboard progression abruptly stalls, an ensemble algorithm can catch that specific breakdown in near real-time.
However, from a user-experience standpoint, we must make sure these systems avoid cognitive overload for teachers. Faculty members are not data scientists; they do not have the bandwidth to dig through raw confusion matrices or decipher complex regression weights during office hours.
That is why clean UI/UX and clear data visualization are just as critical as the underlying algorithms. Early warning indicators need to translate directly into meaningful recommendations—such as suggesting a short review video, opening a micro-quiz, or notifying a teaching assistant to offer a peer study session. By bridging machine learning with empathetic course design, data stops feeling like administrative busywork and becomes a proactive coaching tool that actively protects student retention.
Predictive analytics in education harnesses the power of data to forecast educational outcomes and improve learning experiences.
Schools encounter significant hurdles when implementing predictive analytics, primarily related to data privacy and the associated costs.
Concerns surrounding the security of sensitive student information can hinder the adoption of such technologies, as institutions must guarantee compliance with regulations.
Additionally, the complexities involved in integrating predictive analytics into existing systems often require substantial financial and human resources, posing further challenges to educational institutions.
Data Privacy Concerns
Data privacy concerns represent a significant challenge for educational institutions employing predictive analytics. As schools leverage data to enhance decision-making, they must navigate a complex landscape of privacy regulations and data security measures.
Failure to address these concerns can lead to severe repercussions, including loss of trust and legal penalties. Key challenges include:
- Ensuring compliance with local and federal privacy regulations
- Protecting sensitive student information from data breaches
- Balancing the insights gained from analytics with the need for confidentiality
- Educating staff and students about data privacy best practices
Ultimately, institutions must prioritize data security while fostering an environment where predictive analytics can be utilized responsibly to serve students effectively.
Implementation Costs and Complexities
Maneuvering the complexities of predictive analytics in education extends beyond data privacy concerns; implementation costs and operational challenges also greatly impact institutions.
Budget considerations play an essential role, as schools must allocate financial resources not only for software acquisition but also for ongoing maintenance and training.
Many institutions face difficulties in integrating new technologies with existing systems, often leading to additional expenditures and resource strain.
Furthermore, the need for skilled personnel to interpret data and derive actionable insights adds another layer of complexity.
Resistance to change among staff can further hinder successful adoption, making a thorough strategy essential.
Ultimately, addressing these challenges is critical for schools to effectively harness the potential of predictive analytics for improved decision-making and enhanced educational outcomes.
How to Overcome Challenges in Implementing Predictive Analytics?
Implementing predictive analytics in education presents a myriad of challenges that require strategic solutions to navigate effectively. To address these obstacles, institutions must prioritize certain key strategies:
- Data Integration Strategies: Develop thorough systems that unify disparate data sources, enabling a holistic view of student performance and needs.
- Stakeholder Engagement: Foster collaboration among educators, administrators, and data scientists to guarantee buy-in and address concerns regarding data privacy and usage.
- Training and Support: Equip staff with the necessary skills to interpret data insights and make informed decisions, thereby enhancing data literacy throughout the institution.
- Iterative Feedback Loops: Create mechanisms for continuous evaluation and adjustment of analytics practices, guaranteeing alignment with institutional goals and stakeholder expectations.
Best Practices for Effective Predictive Analytics in Education
Effective predictive analytics in education hinges on the adoption of best practices that enhance the accuracy and applicability of insights derived from data. Schools and universities must implement robust data integration strategies to consolidate disparate data sources, ensuring a thorough view of student performance. Educators can also explore practical teaching resources and instructional materials from the engineering teacher shop to support data-informed lessons, strengthen classroom activities, and create more engaging learning experiences. This holistic approach allows institutions to identify trends and patterns effectively, enabling timely interventions.
Additionally, the utilization of analytical toolkits tailored to specific educational contexts is essential. These toolkits should facilitate the interpretation of data, offering actionable insights that directly inform decision-making. Training educators and administrators in data literacy further empowers them to leverage these insights for strategic planning and resource allocation.
Moreover, fostering a collaborative environment among stakeholders—such as faculty, data analysts, and IT specialists—ensures that predictive models remain relevant and responsive to evolving educational needs.
Future Trends in Predictive Analytics for Educational Decision-Making
As educational institutions increasingly recognize the potential of predictive analytics, several emerging trends are poised to reshape decision-making processes in the sector.
Future innovations in this field promise to enhance educational insights, allowing for more tailored and effective strategies.
Key trends include:
- Real-Time Data Utilization: Institutions will leverage real-time analytics to inform immediate interventions, improving student outcomes.
- AI-Driven Personalization: Advanced algorithms will create personalized learning experiences, catering to individual student needs and preferences.
- Predictive Modeling for Retention: Schools will implement predictive models to identify at-risk students early, enabling proactive support measures.
- Cross-Institutional Data Sharing: Collaborative data sharing among institutions will foster a more thorough understanding of educational dynamics, enhancing overall effectiveness.
These trends highlight the transformative potential of predictive analytics, equipping educators and administrators with the insights necessary to foster student success and institutional growth.

RELATED STUDIES ABOUT PREDICTIVE ANALYTICS IN EDUCATION
To summarize, predictive analytics in education stands as a beacon of potential, illuminating pathways to enhanced decision-making and improved student outcomes. By harnessing data-driven insights, educational institutions can navigate the complexities of learning environments, addressing challenges with strategic foresight. However, as with any powerful tool, the key lies in thoughtful implementation and adherence to best practices. As the landscape of education evolves, embracing these analytics will not merely be advantageous; it will become essential for fostering the leaders of tomorrow.
Predictive analytics in education- enhancing student achievement through machine learning
Conceptual Framework and Research Rationale
- The Educational Imperative for Predictive Analytics: Increasing student diversity in higher education presents challenges for traditional instructional models. Without early diagnostic mechanisms, at-risk students frequently struggle and drop out due to delayed interventions. Predictive analytics enables institutions to leverage historical and real-time academic records to identify learning difficulties proactively, personalize student support, and allocate institutional resources efficiently.
- Limitations of Existing Educational Models: Prior predictive modeling in education has predominantly relied on standalone classifiers (such as linear regression, decision trees, or standalone support vector machines) or retrospective analyses that lack real-time utility. Furthermore, existing research rarely investigates advanced ensemble methods—such as stacking architectures—specifically optimized for heterogeneous, tabular academic datasets.
- Core Research Objectives:
- Systematically compare the predictive performance of standalone machine learning models (Support Vector Machines [SVM], Decision Trees, Random Forests, and Convolutional Neural Networks [CNNs]) in forecasting student achievement.
- Design, train, and validate a novel two-level stacking hybrid model combining deep learning (CNN) and ensemble bagging (Random Forest) base learners with a gradient boosting meta-learner (XGBoost).
- Identify the most influential academic and demographic predictors of student success through feature importance metrics.
- Segment student performance profiles using unsupervised clustering to derive targeted pedagogical and institutional intervention strategies.
Dataset Architecture and Experimental Design
- Data Source and Scope:
- Academic records collected from two higher education institutions in Ethiopia: Wollo University and the Kombolcha Institute of Technology, spanning a five-year academic window (2017–2022).
- The raw institutional repository comprised 32,592 student records. Experimental model evaluation and hold-out validation focused on a processed subset of 24,005 student records.
- Feature Schema:
- Demographic and Background Attributes: Student ID (anonymized identifier, dropped prior to modeling), gender (54.8% male, 45.2% female), geographical region of origin (e.g., South Region [17.4%], Sidamo [16.0%], Addis Ababa [10.6%], Amhara [8.9%]), and reported disability status (Y/N).
- Academic Contextual Attributes: Entrance qualification category (e.g., Higher Education Qualification, A-Level/Equivalent, Lower than A-Level, Postgraduate), number of previous course/exam attempts (num_of_prev_attempts), and total cumulative credits undertaken (studied_credits).
- Prediction Target (final_result): Multi-class categorical outcome consisting of four academic statuses: Distinction, Pass, Fail, and Withdrawn.
- Data Preprocessing and Normalization:
- Missing values (0.8% to 3.4% across features) were resolved via mean imputation for numerical attributes (studied_credits, num_of_prev_attempts) and mode imputation for categorical attributes. Outliers were winsorized using the interquartile range (1.5IQR) method.
- Extreme scale disparities between features (e.g., num_of_prev_attempts scaling 0–10 versus studied_credits scaling up to 240) were standardized using Min-Max scaling into a uniform [0,1] interval, with Z-score standardization tested in parallel.
- Categorical variables were converted via label encoding and one-hot encoding. Feature selection was guided by iterative 5-fold cross-validation with Random Forest feature importance rankings.
- Two-Level Stacking Hybrid Architecture:
- Level-0 (Base Learners): A Convolutional Neural Network (CNN) structured to capture high-order non-linear feature interactions from reshaped tabular arrays, operating alongside a Random Forest classifier that aggregates multiple decision trees to minimize prediction variance and handle categorical diversity. Out-of-fold predictions were generated via 5-fold cross-validation.
- Level-1 (Meta-Learner): An Extreme Gradient Boosting (XGBoost) model trained on the combined out-of-fold predictions of the base learners to produce the final classification decision.
- Model Validation and Hyperparameter Optimization:
- Evaluated through an 80/20 train-test hold-out validation partition, combined with 5-fold cross-validation across all models.
- Hyperparameters were tuned via systematic Grid Search cross-validation. Optimal tuned configurations included:
- CNN: 30 epochs, batch size of 64, 64 filters with (3,3) kernel, dropout of 0.5, learning rate of 0.01.
- Random Forest: 200 estimators, maximum depth of 15, max_features = ‘sqrt’, minimum samples split of 2.
- XGBoost (Meta-Learner): 250 estimators, learning rate of 0.05, maximum depth of 6, subsample ratio of 0.8.
- SVM: RBF kernel, C=10, =0.01.
- Decision Tree: Gini criterion, maximum depth of 10, minimum samples split of 4.
Key Empirical Findings
- Standalone Machine Learning Performance (Pre- and Post-Tuning):
- Among individual classifiers evaluated after hyperparameter optimization, Random Forest achieved the strongest standalone performance, recording 87% accuracy (85% before tuning), 85% precision, 86% recall, 85% F1-score, and an AUC-ROC of 0.89.
- The Classical Neural Network (CNN) followed closely with an accuracy of 85% (82% before tuning), precision of 83%, recall of 84%, F1-score of 83%, and an AUC-ROC of 0.88.
- Traditional baseline models demonstrated lower classification performance on the multidimensional dataset:
- Support Vector Machine (SVM): 83% accuracy (80% before tuning), 81% precision, 82% recall, and an AUC-ROC of 0.86.
- Decision Tree: 81% accuracy (78% before tuning), 79% precision, 78% recall, and an AUC-ROC of 0.82.
- Superiority of the Stacking Hybrid Model:
- The proposed hybrid stacking architecture (CNN + Random Forest XGBoost) outperformed every individual baseline model across all evaluated metrics.
- Baseline (Untuned) Hybrid Model: 85% accuracy, 83% precision, 84% recall, 83% F1-score, and an AUC-ROC of 0.88.
- Optimized (Tuned) Hybrid Model: Achieved 88% to 89% accuracy, 87% precision, 88% recall, 86% to 87% F1-score, and an AUC-ROC of 0.90 to 0.91.
- Statistical Validation: Paired t-tests across the 5-fold cross-validation splits confirmed that the performance gain from the best standalone model (Random Forest) to the hybrid model was statistically significant (p<0.01). The layered architecture leveraged the CNN’s feature representation capabilities alongside Random Forest’s variance reduction, with XGBoost resolving borderline predictions.
- Most Significant Feature Predictors:
- Feature importance rankings and correlation analyses identified studied credits, number of previous attempts, entrance result, and geographical region as the primary determinants of academic outcomes.
- A notable positive correlation emerged between studied credits and previous course attempts (r=0.18), reflecting course repeat dynamics among struggling cohorts.
- Final student outcomes exhibited strong regional variation: the South and Sidamo regions produced the largest volume of passing and distinction grades, while students from remote areas showed higher withdrawal rates.
- Unsupervised Profiling and Silhouette Validation:
- K-means clustering evaluated via the Elbow Method (sum of squared errors plot) identified an optimal structural threshold of k=3 clusters:
- Cluster 1 (n=10,500): High-Performing cohort characterized by high earned credits, low prior failed attempts, and high probabilities of Pass or Distinction.
- Cluster 2 (n=8,000): Mixed-Outcome cohort characterized by moderate credit completion, average prior attempts, and balanced pass/fail outcomes.
- Cluster 3 (n=5,505): Low-Performing / At-Risk cohort characterized by low accumulated credits, a high number of repeated attempts, and high probabilities of Fail or Withdrawn.
- Silhouette validation yielded an average coefficient of approximately 0.40, with Clusters 0, 1, and 3 exhibiting well-defined coherence, while Cluster 2 displayed boundary overlap.
Practical Applications and Actionable Interventions
- Early-Warning Detection for At-Risk Students: Automated classification enables institutions to identify students drifting into Cluster 3 (low credits, repeated attempts) at the start of an academic semester rather than after final exam failures.
- Differentiated Academic Advising:
- Cluster 3 Interventions: Mandate tailored academic tutoring, remedial workshops, peer study groups, and credit load caps to prevent academic dismissal.
- Cluster 2 Interventions: Deploy personalized academic coaching and time-management guidance to address domain-specific hurdles.
- Cluster 1 Interventions: Provide advanced research tracks, honors curricula, and extracurricular leadership pathways.
- Institutional Resource Allocation: Disparities across admission categories and geographic regions allow academic deans to target instructional funding, departmental faculty staffing, and student aid toward regions and departments exhibiting higher historical withdrawal rates.
- Model Explainability for Stakeholders: Combining Random Forest Gini importance with SHAP (SHapley Additive exPlanations) values from the XGBoost meta-learner allows academic advisors to provide transparent, interpretable rationales to students regarding which factors (e.g., credit overload or prerequisite attempts) drive their risk profile.
Study Limitations and Future Research Directions
- Computational Complexity of Stacking: Training a multi-level pipeline containing deep CNNs, Random Forests, and XGBoost introduces substantial computational overhead. Deploying such systems in resource-constrained or underfunded educational environments may require model compression techniques such as knowledge distillation or weight pruning.
- Feature Scope Boundaries: The dataset was restricted to administrative student information systems (SIS) metrics. It omitted longitudinal LMS interaction logs (e.g., login frequencies, assignment submission latency), psychosocial attributes (motivation, academic self-concept), and socioeconomic status indicators.
- Institutional Generalizability: The empirical sample was derived from two Ethiopian institutions (Wollo University and Kombolcha Institute of Technology). Validating model transportability requires multi-institutional testing across diverse international educational frameworks.
- Scalable and Ethical Cloud Implementation: Future work should focus on embedding the stacking model into scalable big data frameworks (such as Apache Spark and containerized Kubernetes clusters) while integrating federated learning protocols to ensure student data privacy and audit models for algorithmic bias.
| REFERENCE: Sunawar khan, Tehseen Mazhar, Tariq Shahzad, Muhammad Amir khan, Wajahat Waheed, Ahsen Waheed, Habib Hamam, Predictive analytics in education- enhancing student achievement through machine learning, Social Sciences & Humanities Open, Volume 12, 2025, 101824, ISSN 2590-2911, https://doi.org/10.1016/j.ssaho.2025.101824. (https://www.sciencedirect.com/science/article/pii/S2590291125005522) |
Predictive analytics in gamified education: A hybrid model for identifying at-risk students
Conceptual Framework and Research Rationale
- The Challenge of Student At-Risk Identification in Gamified Learning: Gamified educational platforms have gained prominence by incorporating mechanics such as scoring systems, public leaderboards, badges, and progressive task completions to increase student engagement and motivation. Despite these benefits, early detection of learners at risk of academic failure, disengagement, and course dropout remains a substantial instructional challenge.
- Multidimensional Data Streams in Gamified Environments: Unlike traditional classrooms that capture only periodic summative exam scores, gamified platforms continuously generate rich behavioral interaction telemetry (e.g., login frequency, activity completion rates, session duration, and dynamic participation levels) alongside formative assessment metrics.
- Limitations of Standalone Classifiers: Conventional statistical techniques such as logistic regression provide clear interpretability and model linear baseline relationships well, but they fail to capture the complex, non-linear interactions characteristic of learner behavior. While non-parametric models such as decision trees and random forests capture non-linear patterns, individual algorithms often exhibit variance or localized bias.
- The Hybrid Ensemble Solution: Combining diverse algorithmic paradigms into an ensemble allows educational monitoring systems to leverage the probabilistic interpretability of linear models alongside the non-linear partitioning depth of tree-based learners.
- Core Research Objectives:
- Develop and validate a hybrid ensemble predictive framework tailored to gamified educational datasets by integrating logistic regression, decision trees, and random forests.
- Compare the classification efficacy of the ensemble architecture against individual standalone classifiers in predicting binary at-risk student outcomes.
- Establish an early-warning computational method enabling timely, proactive educational interventions to support student retention.
Methodology and Technical Implementation
- Data Sources and Feature Preprocessing:
- Utilizes behavioral and academic indicators extracted from a gamified learning platform, capturing quiz scores, participation in gamified activities, task completions, and platform engagement metrics.
- Missing Value Imputation: Handled through median imputation for continuous/numerical variables and mode imputation for categorical features to preserve sample integrity without discarding data records.
- Standardization: Z-score standardization was applied to all continuous features to ensure scale uniformity across diverse metrics.
- Base Classifier Specifications:
- Classifier 1 (Logistic Regression): Serves as the interpretable baseline; trained with L2 (Ridge) regularization and an inverse regularization strength parameter of C=1.0 to penalize extreme coefficients and enhance generalizability.
- Classifier 2 (Decision Tree): Captures non-linear decision thresholds; regularized with a maximum tree depth constraint of 12 (max_depth = 12) to prevent tree overfitting.
- Classifier 3 (Random Forest): An ensemble bagging learner configured with 200 individual decision trees (n_estimators = 200) trained on random bootstrap sub-samples to reduce prediction variance and improve robustness against noise.
- Ensemble Voting Mechanism:
- Base classifiers are independently trained on the partitioned training data.
- Predictions are aggregated using a voting mechanism (evaluated via majority hard voting and probability-weighted soft voting) to balance out individual model classification errors and produce the final at-risk classification.
- Validation and Performance Metrics:
- Evaluated using train/test partitioning alongside a 10-fold cross-validation procedure to ensure stability and guard against overfitting.
- Evaluated across standard classification metrics: Overall Accuracy, Confusion Matrix diagnostics, Precision, Recall, and balanced F1-scores.
Key Empirical Findings
- Standalone vs. Ensemble Classification Performance:
- The proposed hybrid ensemble model outperformed all individual standalone classifiers across every evaluated metric:
- Hybrid Ensemble Model: Achieved a cross-validated accuracy of 96.89% (with an overall test accuracy of 96.67%), a Precision of 100.00%, a Recall of 92.31%, and an F1-score of 96.00%.
- Random Forest: Ranked as the strongest standalone model, achieving an accuracy of 96.67%, a Precision of 100.00%, a Recall of 92.31%, and an F1-score of 96.00%.
- Decision Tree: Reached an accuracy of 93.33%, a Precision of 86.67%, a Recall of 100.00%, and an F1-score of 92.86%.
- Logistic Regression: Yielded the lowest overall predictive performance, recording an accuracy of 86.67%, a Precision of 80.00%, a Recall of 92.31%, and an F1-score of 85.71%.
- Confusion Matrix and Error Diagnostics:
- Across test set evaluation, the ensemble confusion matrix recorded 17 True Negatives (Class 0), 12 True Positives (Class 1), 0 False Positives, and only 1 False Negative.
- Class-specific performance breakdowns:
- Non-at-risk students (Class 0): Precision = 0.944, Recall = 1.000, F1-score = 0.971.
- At-risk students (Class 1): Precision = 1.000, Recall = 0.923, F1-score = 0.960.
- The zero false positive rate demonstrates that the ensemble avoids generating false alarms, ensuring that academic support resources are not misallocated to students who are performing adequately.
- Learning Curve Convergence and Generalizability:
- The learning curve for the voting classifier showed rapid convergence: cross-validation accuracy climbed steeply as the training set size increased from 10 to 20 samples, stabilizing above 95% accuracy beyond 60 samples with narrow variance bands.
- When evaluated on an independent, secondary dataset sourced from another gamified learning platform, the hybrid model maintained high performance, confirming cross-platform transferability and adaptability to differing gamified designs.
Pedagogical and Practical Implications
- Shifting from Retrospective Failure to Early Intervention: By leveraging real-time telemetry from gamified platforms (such as declining badge progress, falling leaderboard rank, and drop-offs in quiz attempts), the ensemble identifies struggling learners well before mid-term or end-of-term exams occur.
- Empowering Educators with Targeted Analytics: The computational model converts complex, multi-stream log data into an actionable binary alert, allowing teachers to deliver targeted remedial tutoring, adjust game-task difficulty, or provide motivational check-ins to specific at-risk learners.
- Resource Optimization in Educational Institutions: High precision ensures that institutional support programs, advising staff, and remedial instructional resources are directed toward students in genuine academic distress.
Limitations and Future Research Directions
- Dependence on Gamification Infrastructure: The framework relies on telemetry unique to gamified learning (e.g., game points, badges, leaderboard movements); its efficacy in traditional, non-gamified educational environments where such behavioral metrics are absent remains limited.
- Absence of Real-Time Dynamic Streaming: The model was evaluated on static data batches rather than real-time event-streaming pipelines; rapid intra-semester fluctuations in student engagement may require periodic model retraining.
- Interpretability Constraints for Non-Technical Users: While standalone logistic regression and individual decision trees offer straightforward rules, the combined voting mechanism can be difficult for non-technical educators to interpret without dedicated explainable AI (XAI) dashboards (e.g., SHAP or LIME attributions).
- Future Research: Subsequent research should explore incorporating deep neural networks and support vector machines into the ensemble, integrating time-series sequence modeling to track engagement degradation trajectories, and conducting longitudinal trials to measure the long-term impact of model-triggered interventions on course completion rates.
| REFERENCE: Devanshu Sawarkar, Latika Pinjarkar, Pratham Agrawal, Devansh Motghare, Predictive analytics in gamified education: A hybrid model for identifying at-risk students, MethodsX, Volume 15, 2025, 103486, ISSN 2215-0161, https://doi.org/10.1016/j.mex.2025.103486. (https://www.sciencedirect.com/science/article/pii/S2215016125003310) |
Personalizing self-management via behavioral predictive analytics with health education for improved self-efficacy
Conceptual Framework and Research Rationale
- The Chronic Disease Self-Management Challenge: Type 2 diabetes and pre-diabetes affect over 115 million Americans and 440 million individuals globally. Although clinical evidence shows that proactive patient self-management (blood glucose monitoring, dietary compliance, physical activity) can improve diabetes symptoms by 10% or more, fewer than 25% of patients actively engage in recommended self-health behaviors.
- Limitations of Standard Health Promotion Programs: Structured lifestyle interventions, such as the Centers for Disease Control and Prevention (CDC) Diabetes Prevention Program (DPP), significantly reduce diabetes incidence. However, traditional programs typically demand in-person attendance over 12 months, creating transportation, scheduling, and cost barriers. Furthermore, conventional digital reminders frequently fail because generic prompts do not account for individual differences in readiness to change.
- Theory-Driven Behavioral Modeling: Rooted in the Theory of Planned Behavior (TPB) and the Information-Motivation-Behavioral Skills (IMB) model, the authors conceptualize “behavior readiness” as a four-dimensional construct: ownership, motivation, intention, and attitude. Personalizing health action prompts to an individual’s specific readiness tier can enhance patient engagement and treatment compliance.
- Core Research Objectives:
- Develop and evaluate a behavioral predictive analytics architecture using manifold clustering to segment patients into behavior-readiness subpopulations without assuming linear relationships among psychological variables.
- Evaluate dynamic weekly personalization via a mobile application (SIPPA Health) to improve engagement and compliance ratios for glucose tracking, diet, and physical activity.
- Test the feasibility and efficacy of delivering a compressed, 3-month asynchronous mobile adaptation of the CDC DPP curriculum to improve diabetes self-efficacy.
Methodological Architecture and Predictive Engine
- Theoretical and Data Foundations:
- Evaluated under an IRB-approved protocol using a sample of 148 diverse adults diagnosed with Type 2 diabetes or pre-diabetes (meanage=49years; meanHbA1c=7.89; 51% female, 49% male; 41.4% Caucasian, 30.9% African American, 13.8% Asian, 7.5% Hispanic).
- Inclusion criteria required age 18, a minimum high school education level, and an HbA1c6.0 or a formal diabetes/pre-diabetes diagnosis.
- Three-Stage Predictive Analytics Pipeline (SIPPA Engine):
- Stage 1 (Behavioral Readiness Scoring): Participants complete a survey mapped via structural equation modeling (SEM) to produce an individualized 14 continuous behavior-readiness vector: [ownership,motivation,intention,attitude].
- Stage 2 (Manifold Subpopulation Clustering): Continuous readiness attributes undergo entropy-based discretization to minimize information loss while converting continuous inputs into discrete states. Manifold clustering identifies non-linear subpopulation clusters based on statistically significant association patterns evaluated via mutual information measures and adjusted chi-square statistics. The 148 participants clustered into discrete subgroups, four of which captured the active intervention cohorts.
- Stage 3 (Closed-Loop Dynamic Personalization): Weekly actionable health recommendations (selecting among glucose self-monitoring, physical activity, and dietary tracking) are assigned through a two-tiered decision rule:
- Individual Auto-Regression: For participants with sufficient time-series history (T4weeks), an l-th order autoregressive model predicts the change in engagement ratio ($\Delta\text{ER}^{T+1}$) using Akaike or Bayesian Information Criteria (AIC/BIC) for lag selection.
- Population-Based Bayesian Models: If an individual’s autoregressive derivation fails due to sparse early data, the system falls back on the cluster-specific empirical joint probability distribution ($\text{ArgMax } \text{Pr}(\Delta\text{ER} \mid \text{ER}^T)$). The system selects whichever health action yields the largest predicted positive change in engagement.
- Intervention Delivery and Metrics:
- Delivery Platform: The SIPPA Health mobile application delivered daily educational wisdom, automated SMS/push notification reminders, and in-app logging tools for glucose, diet, and physical activity.
- Quantitative Metrics:
- Compliance Ratio (CR): The proportion of completed health activities relative to clinically recommended frequencies over a given time window.
- Engagement Ratio (ER): The ratio of user interactions (responses to prompts) divided by the total number of outbound system messages and notifications.
- Health Education and Self-Efficacy Assessment Protocol:
- Evaluated across 34 participants who completed the full mobile CDC DPP curriculum over a 3-month intervention period.
- Administered the validated Diabetes Self-Efficacy Questionnaire (DSEQ), reduced from 52 to 39 items to mitigate survey fatigue, evaluating five core subscales across both Belief (perceived importance) and Action (confidence to execute):
- Scale 1: Managing social, emotional, and food-related aspects of diabetes.
- Scale 2: Communicating with healthcare professionals and planning.
- Scale 3: Managing hypoglycemia / low blood sugars.
- Scale 4: Managing diabetes related to exercise, blood glucose, and prevention.
- Scale 5: Integrating knowledge and day-to-day care routines.
- Three-Wave Repeated Measures: Administered at baseline enrollment (Pre-survey), following a 1-month unassisted control hold period prior to onboarding (Post-survey), and upon completion of the 3-month mobile intervention (Exit-survey). Analyzed via repeated-measures ANOVA (ANOVA-RM) with Greenhouse-Geisser sphericity adjustments and planned within-subject contrasts.
Key Empirical Findings
- Feasibility of Behavioral Predictive Analytics:
- Retrospective Autoregressive Validity (n=21): Statistically valid autoregressive models were derived for 21 of 49 active intervention participants. Comparing predicted versus observed weekly compliance ratios yielded strong, statistically significant correlations across four prediction weeks:
- Week 1: R=0.5178,p=0.00095.
- Week 2: R=0.6673,p=0.0162.
- Week 3: R=0.7698,p=4.510-5.
- Week 4: R=0.7008,p=0.0004.
- Because more than half of the participants lacked sufficient longitudinal density to support standalone autoregression, the findings confirm that manifold clustering and population-based fallback models are structurally necessary for real-world onboarding.
- Impact of Personalization on Patient Engagement (n=22):
- Across an 11-week forward-looking trial, personalizing actionable health prompts significantly improved patient engagement rates:
- The average engagement ratio with behavioral personalization was 0.31 (95% CI [0.17, 0.45], SD=0.33).
- The baseline engagement ratio without personalization was 0.26 (95% CI [0.13, 0.38], SD=0.31).
- Personalization generated an average relative engagement improvement of approximately 20% compared to pre-intervention baseline levels.
- Subpopulation Heterogeneity: Subpopulation Clusters 1 and 2 exhibited higher average engagement, and tailored prompts helped lower-performing clusters progressively improve participation over the 11-week window.
- Diabetes Self-Efficacy Improvements (ANOVA-RM on DSEQ, n=34):
- Stability During the Pre-Intervention Hold Period: Across all subscales, comparisons between the Pre-survey and Post-survey (the 1-month period without intervention) showed no statistically significant differences (p>0.05), confirming that self-efficacy remained stable in the absence of active support.
- Overall Belief-Level Self-Efficacy: Evaluating aggregate belief scores across all items revealed a statistically significant improvement following the mobile intervention (F=4.185,p=0.019; within-subject pre-to-exit contrast F=7.272,p=0.011). Sample means climbed from 4.396 at baseline to 4.590 at exit.
- Subscale-Specific Belief Gains: Statistically significant improvements emerged on two critical dimensions:
- Scale 4 (Exercise, blood glucose management, and prevention): F=4.361,p=0.017; pre-to-exit contrast F=6.074,p=0.019 (mean rose from 4.464 to 4.674).
- Scale 5 (Integrating knowledge and day-to-day care): F=5.406,p=0.007; pre-to-exit contrast F=10.383,p=0.003 (mean rose from 3.946 to 4.332).
- Scale 1 (Social/emotional/diet management) trended positively toward significance (p=0.072).
- Action-Level Self-Efficacy: While aggregate action self-efficacy did not show a statistically significant shift across all 39 items (F=1.483,p=0.236), Scale 5 Action (confidence in integrating daily self-care) improved significantly (F=3.645,p=0.040 after Greenhouse-Geisser correction; pre-to-exit contrast F=5.802,p=0.022; mean rose from 3.714 to 4.081).
- Action Scale 4 did not achieve statistical significance (p=0.234), indicating that while a 3-month digital program successfully builds knowledge and health beliefs, cultivating confidence to execute complex lifestyle changes requires extended support.
Theoretical and Clinical Implications
- Asynchronous Mobile Delivery of Public Health Curricula: The study demonstrates that evidence-based behavioral curricula (such as the CDC DPP) can be adapted from year-long in-person formats into asynchronous, mobile-first delivery without losing educational efficacy. This expands program accessibility for underserved populations who face scheduling or transportation barriers.
- Non-Linear Subpopulation Targeting: Conventional k-means and linear factor models struggle to capture non-linear relationships in behavioral psychology. Manifold clustering identifies discrete readiness phenotypes, allowing health platforms to personalize action prompts to the specific psychological readiness of each subgroup.
- The Belief-Action Gap in Short-Term Interventions: Significant gains in belief across Scales 4 and 5 alongside action gains restricted to Scale 5 illustrate that health literacy and perceived importance develop faster than behavioral confidence. Digital self-management programs must provide ongoing reinforcement beyond 90 days to help patients translate new knowledge into sustained physical habits.
Study Limitations and Future Directions
- Sample Size and Pilot Duration: The clinical personalization cohort (n=22) and the self-efficacy evaluation sample (n=34) were modest, and the 3-month intervention period was too brief to assess long-term glycemic control (HbA1c reduction) or post-intervention relapse.
- Exclusion of Mental Health Support: The mobile curriculum omitted specialized mental health counseling, which likely accounted for the sub-threshold significance observed in Scale 1 (managing emotional aspects of diabetes).
- Language and Reading Level Constraints: The pilot evaluated only the English-language version of the CDC DPP and required a minimum high school reading level, excluding populations with limited health literacy or non-English language preferences.
- Prioritization Bias: Recommending actions that yield the largest immediate predicted increase in engagement may inadvertently neglect disengaged users who have lower baseline probabilities of response.
- Future Research: Subsequent investigations should deploy randomized controlled trials with multi-year follow-up, incorporate Social Determinants of Health (SDoH) into manifold clustering algorithms, and test multi-lingual mobile interfaces across broader demographic groups.
| REFERENCE: Bon Sy, Michael Wassil, Alisha Hassan, Jin Chen, Personalizing self-management via behavioral predictive analytics with health education for improved self-efficacy, Patterns, Volume 3, Issue 6, 2022, 100510, ISSN 2666-3899, https://doi.org/10.1016/j.patter.2022.100510. (https://www.sciencedirect.com/science/article/pii/S2666389922001027) |
CONCLUSION
Reflecting on where educational technology is heading, it is clear that predictive analytics is no longer a futuristic luxury—it is becoming a core pillar of modern digital pedagogy. Yet, its long-term success will never be measured purely by algorithmic precision or how complex our stacking models look on paper. The true metric is whether we can use these tools to build a more equitable, encouraging, and human-centered learning journey. In STEM fields especially, where students frequently face imposter syndrome and high attrition rates, having an educational environment that notices when you stumble and discreetly hands you a stepping stone can transform an entire academic career.
As institutions adopt these predictive frameworks, our primary responsibility as educators and designers is to ensure the technology remains grounded, transparent, and ethically safeguarded. We must prioritize student privacy, demystify the data for our teaching staff, and remember that an algorithm should never define a learner’s potential—it should merely illuminate how we can best support it.
When we combine high-performing computational models with thoughtful instructional design and compassionate teaching, we move beyond merely reacting to grades. We build an educational ecosystem where every student has the targeted support they need to persist, master complex concepts, and cross the finish line.
